



Opening for the person at the wheel
Right then — you run a fleet and what you want most is clear answers, not a muddle of numbers. Start by thinking like the crew on site: what decisions do you make day-to-day? Which ones would you make quicker if you had tidy, trustworthy numbers? For many of us working with mining fleet management, the need’s simple: know vehicle health, payloads, cycle times and safety events so stoppages get dealt with before they bite. I’ve advised haulage crews in the Pilbara, Western Australia for over ten years, so this comes from hands-on fixes as much as from dashboards.

Core user-centric metrics to track
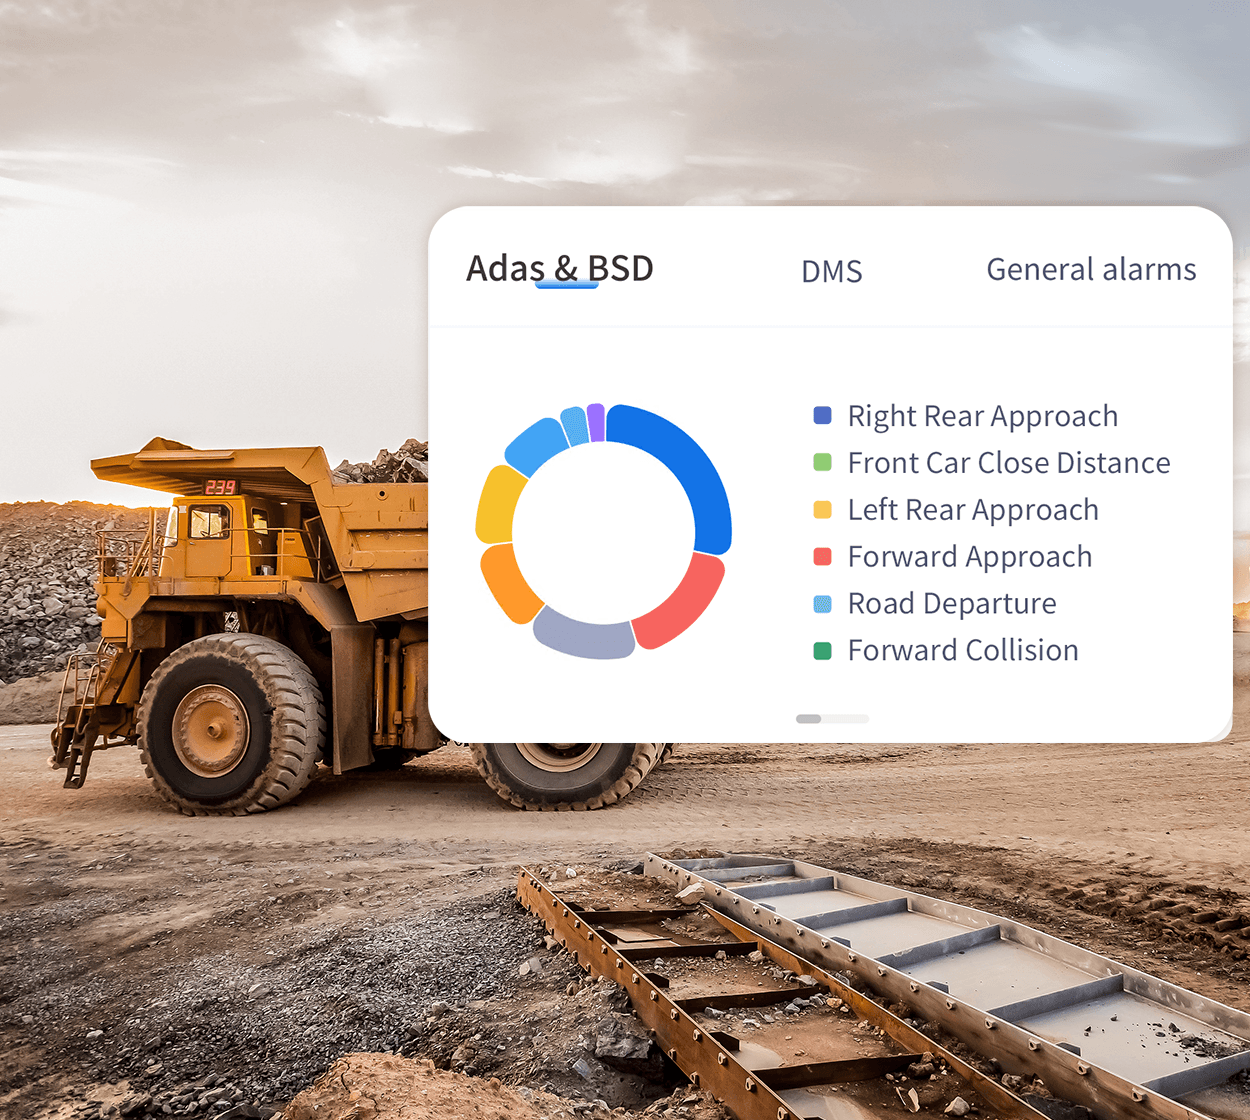
Track only what directly helps a decision. Here’s a tight list you can act on today:- Utilisation: hours driven vs available hours per vehicle.- Payload accuracy: loaded tonnes per trip and under/over-loading frequency.- Cycle time breakdown: queue time, haul time, dump time — measure the slow bits.- Fuel consumption per tonne-km: helps spot inefficient units or routes.- Fault codes and downtime minutes: isolate recurring faults and costly failures.- Safety events: harsh braking, rollovers, near-miss entries, and seat-belt compliance.- Component hours (engine, transmission, tyres): schedule maintenance to parts life, not calendar.- Geo-adherence: route deviations and off-route speed events.
Where to pull the data from
Match metrics to clean sources. Use telematics for movement, onboard CANbus for engine and fault codes, scales or payload sensors for load, and operator logs for context. Don’t mix raw GPS with sampled telemetry without a timestamp plan. If you’re tempted to rely on spreadsheets, know their place: ok for quick checks, poor for consistent trend detection.
How to structure reports for decisions
Reports must answer three questions: what’s wrong, why it’s wrong, and what to do next. Keep reports short and situational:- Daily dashboard: exceptions only — vehicles out of spec, safety breaches, critical faults.- Weekly trend: utilisation, fuel per tonne, cycle times with the top three problem vehicles.- Monthly root-cause: recurring failures, mean time between failures, repair lead times.Use simple visuals: a trend line for cycle time, a bar showing top fault drivers, a table of top offenders. If an entry doesn’t change a decision, don’t track it.
Common pitfalls operators fall into
You’ll see the same mistakes on sites that struggle:- Collecting everything and acting on nothing.- Ignoring data quality: unsynced clocks, missing timestamps, miscalibrated payload sensors.- Treating telematics like a black box: operators need explanations, not just flags.- Over-reporting: too many KPIs dilute focus — pick 6–8 primary ones.- Not closing the loop: report shows problem, nothing gets done. Set owners and deadlines.
Compare quick fixes with integrated platforms
Choices are simple: bolt-on sensors and spreadsheets will get you to basic insight fast, but they fragment data and create work. Integrated platforms tidy timestamps, fuse CANbus and GPS, and push alerts to owners. The trade-off is initial setup time versus sustained, low-friction decisions. For many sites a staged approach works: start with high-value metrics on spreadsheets, then migrate those same metrics into a single platform once you know the thresholds that matter.
Practical rollout — from pilot to steady state
Start small and prove value:- Pick 10 vehicles that represent common failure modes.- Define the one daily and one weekly report you’ll use to act.- Run the pilot for 6–8 weeks, log actions taken and outcomes.- Standardise data collection (timestamps, sensor calibration) and make the reports part of the shift handover.Expect resistance at first; show quick wins — reduced downtime or fewer safety events — and people come round.
Common dashboards and alert thresholds to adopt
Don’t overthink thresholds. Use practical triggers:- Faults: alert after fault repeats 2 times within 48 hours.- Payload variance: alert when a load is 5% under target for 3 consecutive trips.- Cycle time: flag when actual exceeds baseline by 15%.- Fuel burn: alert when fuel per tonne rises by 10% month-on-month.Make each alert assignable to a named person and require one-line acknowledgement and next step.
How to make the data trusted by crews
Trust comes from transparency. Share how metrics are measured. Involve operators in setting payload tolerances and in validating fault definitions. When crews see the report helped fix a vehicle faster or cleared a false alarm, they’ll use it. Be plain about limits: if a sensor drifts, mark the data until fixed.
Where operators usually spend effort next
Once basic reports are steady, teams typically push into:- Predictive maintenance: use component-hour patterns to forecast failure windows.- Route optimisation: blend cycle time and geo-data to cut idle time.- Behaviour coaching: reduce harsh events with targeted training, not punishment.If you’re weighing options, test small changes and measure the specific metric you want to improve — don’t chase vague goals.
Closing thought
Keep it simple, make it useful, and make sure each number leads to an action. That’s how data becomes trusted by the crew and used by management. For operators who want the data to behave this way without fuss, there are platforms built to stitch vehicle, payload and safety data into clear, assignable reports — which is precisely the practical help BSJ aims to provide on site and in the office.

